
The Art and Science of Pricing: Maximizing Earned Revenue for the Performing Arts
Cindy Grzanowski, Vice President
Establishing prices in the performing arts can be a daunting task. One needs to understand market demand—how much customers are willing to pay for each performance—and how to differentiate prices within each performance to both align with demand and achieve revenue targets. Most organizations are under pressure to increase earned revenue each year through a combination of greater attendance and higher prices. While each organization has a different situation, increasing prices too often can lead to customer fatigue, especially among subscribers. Instead of implementing blanket percentage increases, organizations can use available data to determine when and where price changes are optimal and adopt a variety of variable pricing solutions that will lead to a positive impact on revenue.
In this issue of Arts Insights, we will explore variable pricing techniques and provide conventional tips on how to determine if your organization is maximizing its earned revenue potential. First, it is important to understand the difference between variable and dynamic ticket pricing.
- Variable Pricing: Establishing predetermined ticket prices that vary based on seat location, time of day, day of the week, or performance type before an event goes on sale. Variable pricing based on seat location is sometimes also referred to as differentiated pricing.
- Dynamic Pricing: The practice of changing prices after an event is on sale based on customer demand (i.e., increasing prices for events that are selling quickly or lowering prices for events with soft demand).
Know Your Competition
Comparing prices to your primary competitors is an easy exercise that many organizations overlook. It can be time-consuming, and you may easily dismiss the task because data compiled in the past did not produce constructive or actionable results. It is essential to benchmark prices every year because your competition may be changing its prices as often—or more often—than you, and your customers know. Make it easy by keeping it simple. Choose two local organizations in your competitive set and two national organizations within your industry that have similarly sized operating budgets and earned revenue goals. Then, review the published prices and seat maps available online to benchmark your organization.
Talk To Your Sales Team
Your customer service representatives are talking to patrons every day. Customers who take the time to call are seeking personalized attention. As a result, representatives possess a deep knowledge of patrons’ perceived value and seat selection priorities. In addition, sales representatives look at seating charts regularly so they can tell you which seats are in high demand in each section, the seats that consistently remain unsold, and how these patterns may change based on performance type or day of week. Your phone room is a goldmine of information. Meeting with the sales team weekly to understand these dynamics will provide you with valuable information about the effectiveness of your current pricing structure.
Observe Your Subscribers
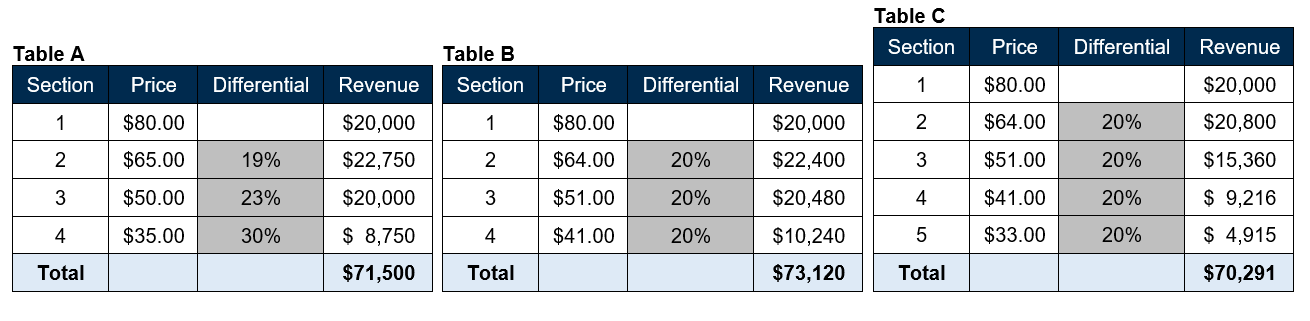
One of the easiest ways to determine the most popular seats in your venue is to examine your long-term subscribers’ behavior. Even the most price-sensitive subscriber will choose the very best seats in the lowest priced sections. Print a seating chart that shows where subscribers of five or more years are seated, then overlay the price chart. Calculate the percent differential between each section and determine if there are correlations to customer behavior. This could reveal obvious opportunities for increasing prices and likewise, the need to rescale certain seats into a lower-priced section.
Table A shows an even distribution of prices with a $15 break between each price point, however the percent differential becomes increasingly higher at the lower end. Table B shows a discount equilibrium of 20 percent, yet this scenario may not be appealing with $41 as the lowest price point. In this case, adding a fifth price to maintain accessibility at the lower end may be required, as shown in Table C. By altering the number of seats available in each section, these adjustments have a minimal impact on revenue potential.
Analyze Single Ticket Demand
Looking at average single ticket buyer prices for each performance is also useful in determining demand however it does not tell the full story. One assumes that a higher single ticket price equates to strong demand and a lower ticket price implies that discount promotions are required to move inventory. It is important to remember that single ticket buyers do not have access to the best seats in the house until renewing subscribers have been seated. In general, single ticket prices that are less than 70 percent of gross potential indicate excessive discounting and price erosion, meaning that prices or seat maps (or both) are not aligned with customer demand.
On occasion, low single ticket prices could be due to high subscription rates. Since subscribers tend to sit in prime sections of the venue at special events, single ticket buyers may only have the option of purchasing low-priced seats. While this is rare, it does happen, so it is important to examine both sides of the equation to be certain.
A critical metric to determine if your venue is accurately scaled and events are appropriately priced is the percentage of single ticket buyers that pay full price. If you have the internal resources, examine the data within each price section for every performance and aggregate data for similar performance types, days of the week, and performance times. Patterns will emerge to reveal opportunities for changing prices or altering price maps by moving seats from one designated price section to another to better align with sales patterns. By more closely aligning prices and seat maps to demand, you will achieve more uniform sales throughout your venue, reduce discounting efforts, and retain more of your gross potential revenue.
Switch Up Your Seating Charts
Many performing arts organizations have price sections that follow a concentric circle pattern, either emanating from the stage or the center of the main floor depending on the venue design and performance type. These maps are usually created based on acoustics or sightlines to the stage and change minimally over time. What would the maps look like if they were created using customer demand?
Customer buying patterns vary by performance type, which means the best seats in the house change from one performance to the next. Take, for example, an orchestra concert that includes a full-length feature film alongside a live performance of the movie score. The movie screen is now a major focal point to the concert experience and the value of certain seats in the venue has changed. The price map should be adapted to reflect this. Similarly, a solo performance featuring a prominent contemporary artist would garner higher ticket prices for the first several rows due to high demand for an up-close and personal experience. Understanding these patterns is key to matching each event with the correct seating map, not only to maximize revenue but also to ensure that there are no apparent gaps (i.e., large sections of empty seats) on performance day.
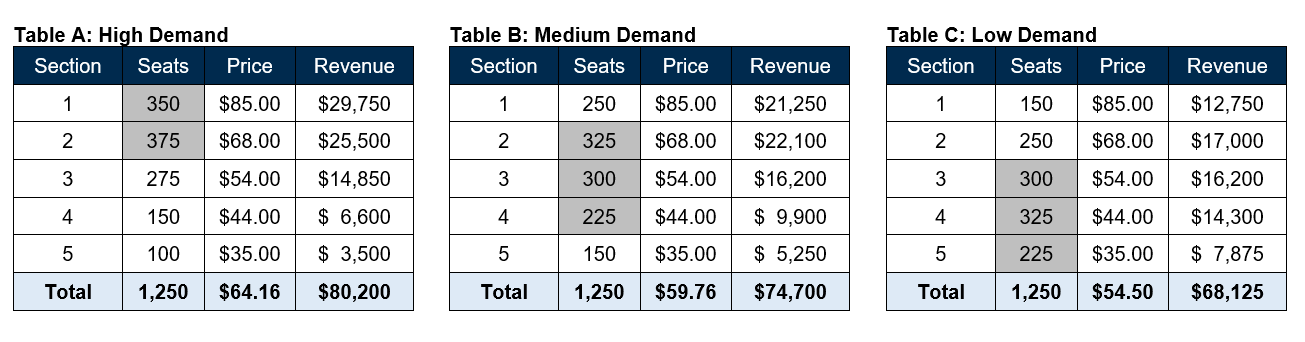
Most performing arts organizations have a revenue budget for each individual performance. In some cases, depending on program or time of year considerations, it becomes evident that certain events will be generate more ticket sales than others. Implementing variable pricing in this case could have a potentially harmful effect on your institution’s brand and value proposition. For this situation, implementing different demand maps is a valuable technique that allows you to publish the same ticket prices for all events while influencing buying patterns by changing the number of seats in each section.
As the tables below demonstrate, the number of seats designated in each pricing section fluctuate based on anticipated customer demand, with a corresponding change in gross potential revenue. Table A represents a high demand event, with nearly 60 percent of the house in the top-priced sections. Table B should be employed for standard events with the majority of seating options in the middle-priced sections. Table C is weighted towards the lower-priced sections and is useful for events with anticipated softer demand. Alternatively, demand charts can also be applied to day of the week, with more seats at higher price points for weekend performances and fewer for weeknight events. Determining which demand maps to apply to each event requires careful consideration and often involves input from multiple team members to balance a variety of factors unique to each organization.
Conclusion
Aligning prices and seating charts with customer demand is an effective way to increase revenue and retain revenue that has traditionally been lost to discounting. Applying variable pricing also sets an expectation with recurring single ticket buyers that their favorite seats may have a different price tag on a different day of the week or for a different performance type. This could lead to a long-term benefit of providing an incentive for customers to purchase tickets early or become subscribers.
Managing ongoing variable pricing tactics can feel overwhelming, but it does not need to be complicated. While there are a multitude of choices, oftentimes the best solution is to listen to your frontline team, observe and analyze your customer behavior, and develop a culture of ongoing experimentation, learning, and refinement.
 Cindy Grzanowski
Vice President
Joining ACG in 2017 to lead the firm’s Earned Revenue Enhancement practice, Cindy Grzanowski has more than 20 years of experience in marketing high-profile arts, cultural, and entertainment institutions. She has demonstrated success in creating strategic, multi-channel marketing campaigns through paid, owned, and shared media that build attendance, brand visibility, and sustainable revenue growth. Her areas of expertise include brand strategy, sales growth, pricing and revenue management, audience development, data-driven customer relationship management (CRM) strategies, digital advertising, website and social media strategy, media planning, direct response marketing, sponsorship, consumer research, and communications. Throughout her career, she has consistently delivered or exceeded multimillion dollar earned revenue goals and identified trends that improve return on investment. As Director of Marketing for Single Ticket Sales at the Minnesota Orchestra, Ms. Grzanowski increased single ticket revenue for the Classical flagship season by 68 percent in her last five seasons by implementing demand-based pricing, aggressive digital marketing, and targeted CRM tactics. She has directed multiple strategic planning, audience development, research, and rebranding initiatives that have achieved tangible results. She has also served as Associate Director of Marketing at the San Francisco Symphony and as Director of Marketing and Public Relations at Underwater Adventures (now Sea Life Aquarium). She holds bachelor of arts in economics and Latin from St. Olaf College and a digital marketing certificate from University of St. Thomas, Opus College of Business.
Contact ACG for more information on how we can help your organization
implement effective pricing strategies and maximize earned revenue.
(888) 234.4236
info@ArtsConsulting.com
ArtsConsulting.com
Click here for the downloadable PDF.