Recent Trends in Philanthropic Giving
An Annual Report on Key Metrics
The close of an organization’s fiscal year provides an excellent opportunity to assess financial performance, including challenges and successes in the fundraising arena. One important element of such a review is a fact-based understanding of the current philanthropic climate, both regionally and nationally. Rather than rely on past conclusions or general giving patterns, it is advantageous to review the most current data on national funding trends. Research from two widely regarded sources, Giving USA and Bank of America Private Bank (formerly U.S. Trust), can provide context and benchmarks for understanding recent financial performance of arts and culture organizations compared to overall nonprofit philanthropic trends.
Overall Charitable Giving
Giving USA 2019: The Annual Report on Philanthropy for the Year 2018 provides a wealth of current data on philanthropic giving. Researched and written by the Indiana University Lilly Family School of Philanthropy, this publication of the Giving USA Foundation provides an excellent overview of nationwide philanthropic trends.
The report estimates that total charitable giving from all sources was approximately $428 billion in 2018, an increase of 0.7 percent in current dollars or a decrease of 1.7 percent adjusted for inflation. This is the second consecutive year that giving has exceeded $400 billion in a single year. Though charitable giving remained high, buoyed by a 5 percent increase in personal disposable income and 5 percent growth in the GDP, the results for charitable giving showed an uneven distribution of growth among giving sectors. A shift in previous giving patterns can be attributed to several factors, most importantly the new tax policy and instability of the stock market. Individuals and households gave less, most likely in response to the tax policy doubling the standard deduction, while foundations and corporations’ contributions were able to contribute more, in part due to a healthy stock market for the last several years. The decline of the stock market in late 2018 may have had a more recent negative effect across giving segments—adding to the complex giving climate.
Last year, total giving for nonprofit organizations and charities increased in three out of four major funding sectors. At $292 billion, individual donor giving remains the highest major funding sector, though it comprised less than 70 percent of overall giving for the first time in 50 years.

Arts and Culture Giving Is Flat
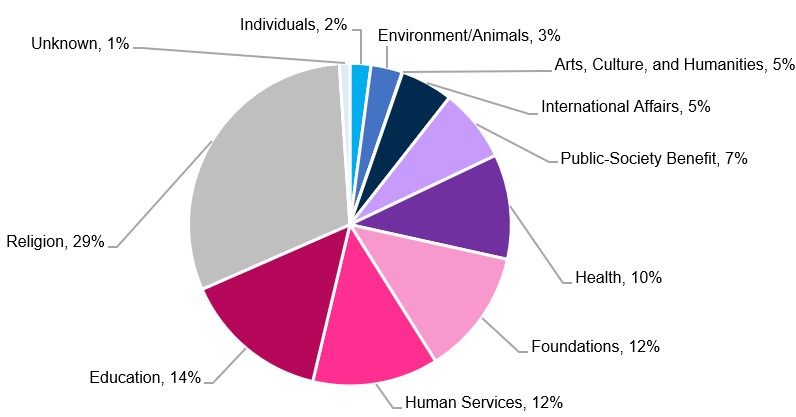
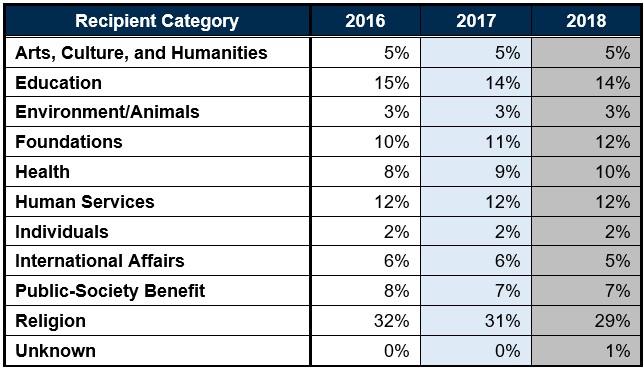
Giving USA Foundation’s report shows that charitable contributions in 2018 increased in only two of the nine major types of recipient organizations (international affairs and environment/animals), with the arts and culture sector (arts, culture, and humanities) receiving an estimated $20 billion in contributions from all sources. This is only a 0.3 percent increase from the previous year and a 2 percent decrease after inflation adjustments, making up 5 percent of the overall 2018 total. Giving to foundations increased the most after a strong 2017, and International affairs organizations showed the largest growth of the sectors.
The following graphics show the 2018 contributions by recipient category by percentage of the total as well as percentage comparisons with reported 2016 and 2017 contributions.


A free overview of the Giving USA 2019 Infographic provides context and insight into this year’s report. The complete report contains detailed data analysis and is available for purchase through the site in several formats.
Focus on Donor Motivations
Giving is a very personal behavior that reflects emotional needs and individual philanthropic goals. Bank of America’s 2018 U.S. Trust Insights on Wealth and Worth® survey examines charitable practices and preferences of wealthy households. The survey affirms that giving back to society is a priority among the vast majority of high-net-worth individuals and families. According to the findings, contributing to the greater good is an important goal for these individuals and families, listing the following as how they make an impact:

Giving Trends in Canada
According to the 2018 Global Trends in Giving Report, the sister report to the Global NGO Technology Report, philanthropic giving trends throughout North America mirror those solely in the United States. Of the 2,605 North American survey participants, 76 percent stated that they volunteer their time and 66 percent stated that they attend fundraising events. Health and wellness (12 percent), children and youth (11 percent), and animals and wildlife (9 percent) were the top three giving recipient categories in North America. The Global Trends in Giving Report provides additional information indicating how all North Americans give, with 60 percent of North American donors preferring to give online, compared to 17 percent through direct mail, 8 percent through PayPal, 6 percent with cash, and 5 percent bank/wire transfer. At 51 percent, the majority of respondents indicated that the social media platform that inspires the most giving was Facebook.
Incorporating Data into Philanthropy
It is vital that arts and culture organizations create strong, healthy philanthropic cultures. Part of that effort is focused on the inclusion of both hard and soft data when developing solicitation strategies. While it is critical to examine the quantifiable facts, such as where and how much donors give, a review of the softer data related to specific donor relationships and interests is crucial. Arts and culture organizations should use data to ask their donors leading questions, listening carefully over time to ensure a clear understanding of the impacts they seek prior to asking for a contribution. Focus on their motivation for giving, connection to the organization, and the culture of philanthropy in their household or business. Consider the recency, frequency, and capacity for giving and how that might best inform their potential level of financial commitment. The answers to these questions, as well as proper donor research, provide significant insights and support the building of stronger relationships with donors—resulting in increased contributed revenue for arts and culture organizations.
Meet the ACG Contributed Revenue Enhancement Team

Linda Lipscomb, Vice President
Linda Lipscomb joined ACG in 2016, bringing nearly 30 years of experience in all areas of fundraising, including facilitating major capital campaigns, maximizing annual funds and major gift programs, conducting feasibility studies, and performing interim management services. Ms. Lipscomb has served in several interim management roles, leading the development departments at Fort Worth Opera, Fort Worth Symphony Orchestra, and Vancouver Art Gallery. She has also guided capital campaign efforts at Ruth Eckerd Hall and The Independent School, among others. In her role as Interim Vice President of Development at Fort Worth Symphony Orchestra, she was responsible for achieving annual contributions of $5 million and successfully led the effort to meet a $1.5 million challenge grant goal. Her work extends to ACG’s Executive Search practice, supporting clients through critical leadership transitions and assisting with the placement of executive leadership and key fundraising roles. Prior to joining ACG, she led the development departments for the Dallas Museum of Art, Virginia Museum of Fine Arts, American Red Cross in Dallas, and Dallas Symphony Orchestra. Ms. Lipscomb holds a bachelor of arts in history of art from Sweet Briar College in Virginia and a master of business administration in finance and marketing from Southern Methodist University. As an active volunteer, she currently serves on the board of directors for Friends of Art of Sweet Briar College and chairs the marketing committee.
Contact ACG for more information on how we can help your organization achieve
its contributed revenue enhancement goals.
(888) 234.4236
info@ArtsConsulting.com
ArtsConsulting.com
Click here for the downloadable PDF.
